Ching-Chuan Chen's Blogger

Statistics, Machine Learning and Programming

0%

Write a Generalized Plotting Function Via R

這篇主要是介紹怎麼利用Rggplot2去寫一個generalized的畫圖函數

先載入資料,轉成data.table,以及把factor的欄位都轉成character

1
2
3
4
5
6
7
8
library(ggplot2)
library(data.table)
library(pipeR)

data("diamonds")
factorCols <- names(diamonds)[sapply(diamonds, is.factor)]
diamondsDT <- data.table(diamonds) %>>%
`[`(j = eval(factorCols) := lapply(.SD, as.character), .SDcols = factorCols)

目標是把下面這張圖做成一個generalized plotting function來應付各種需求
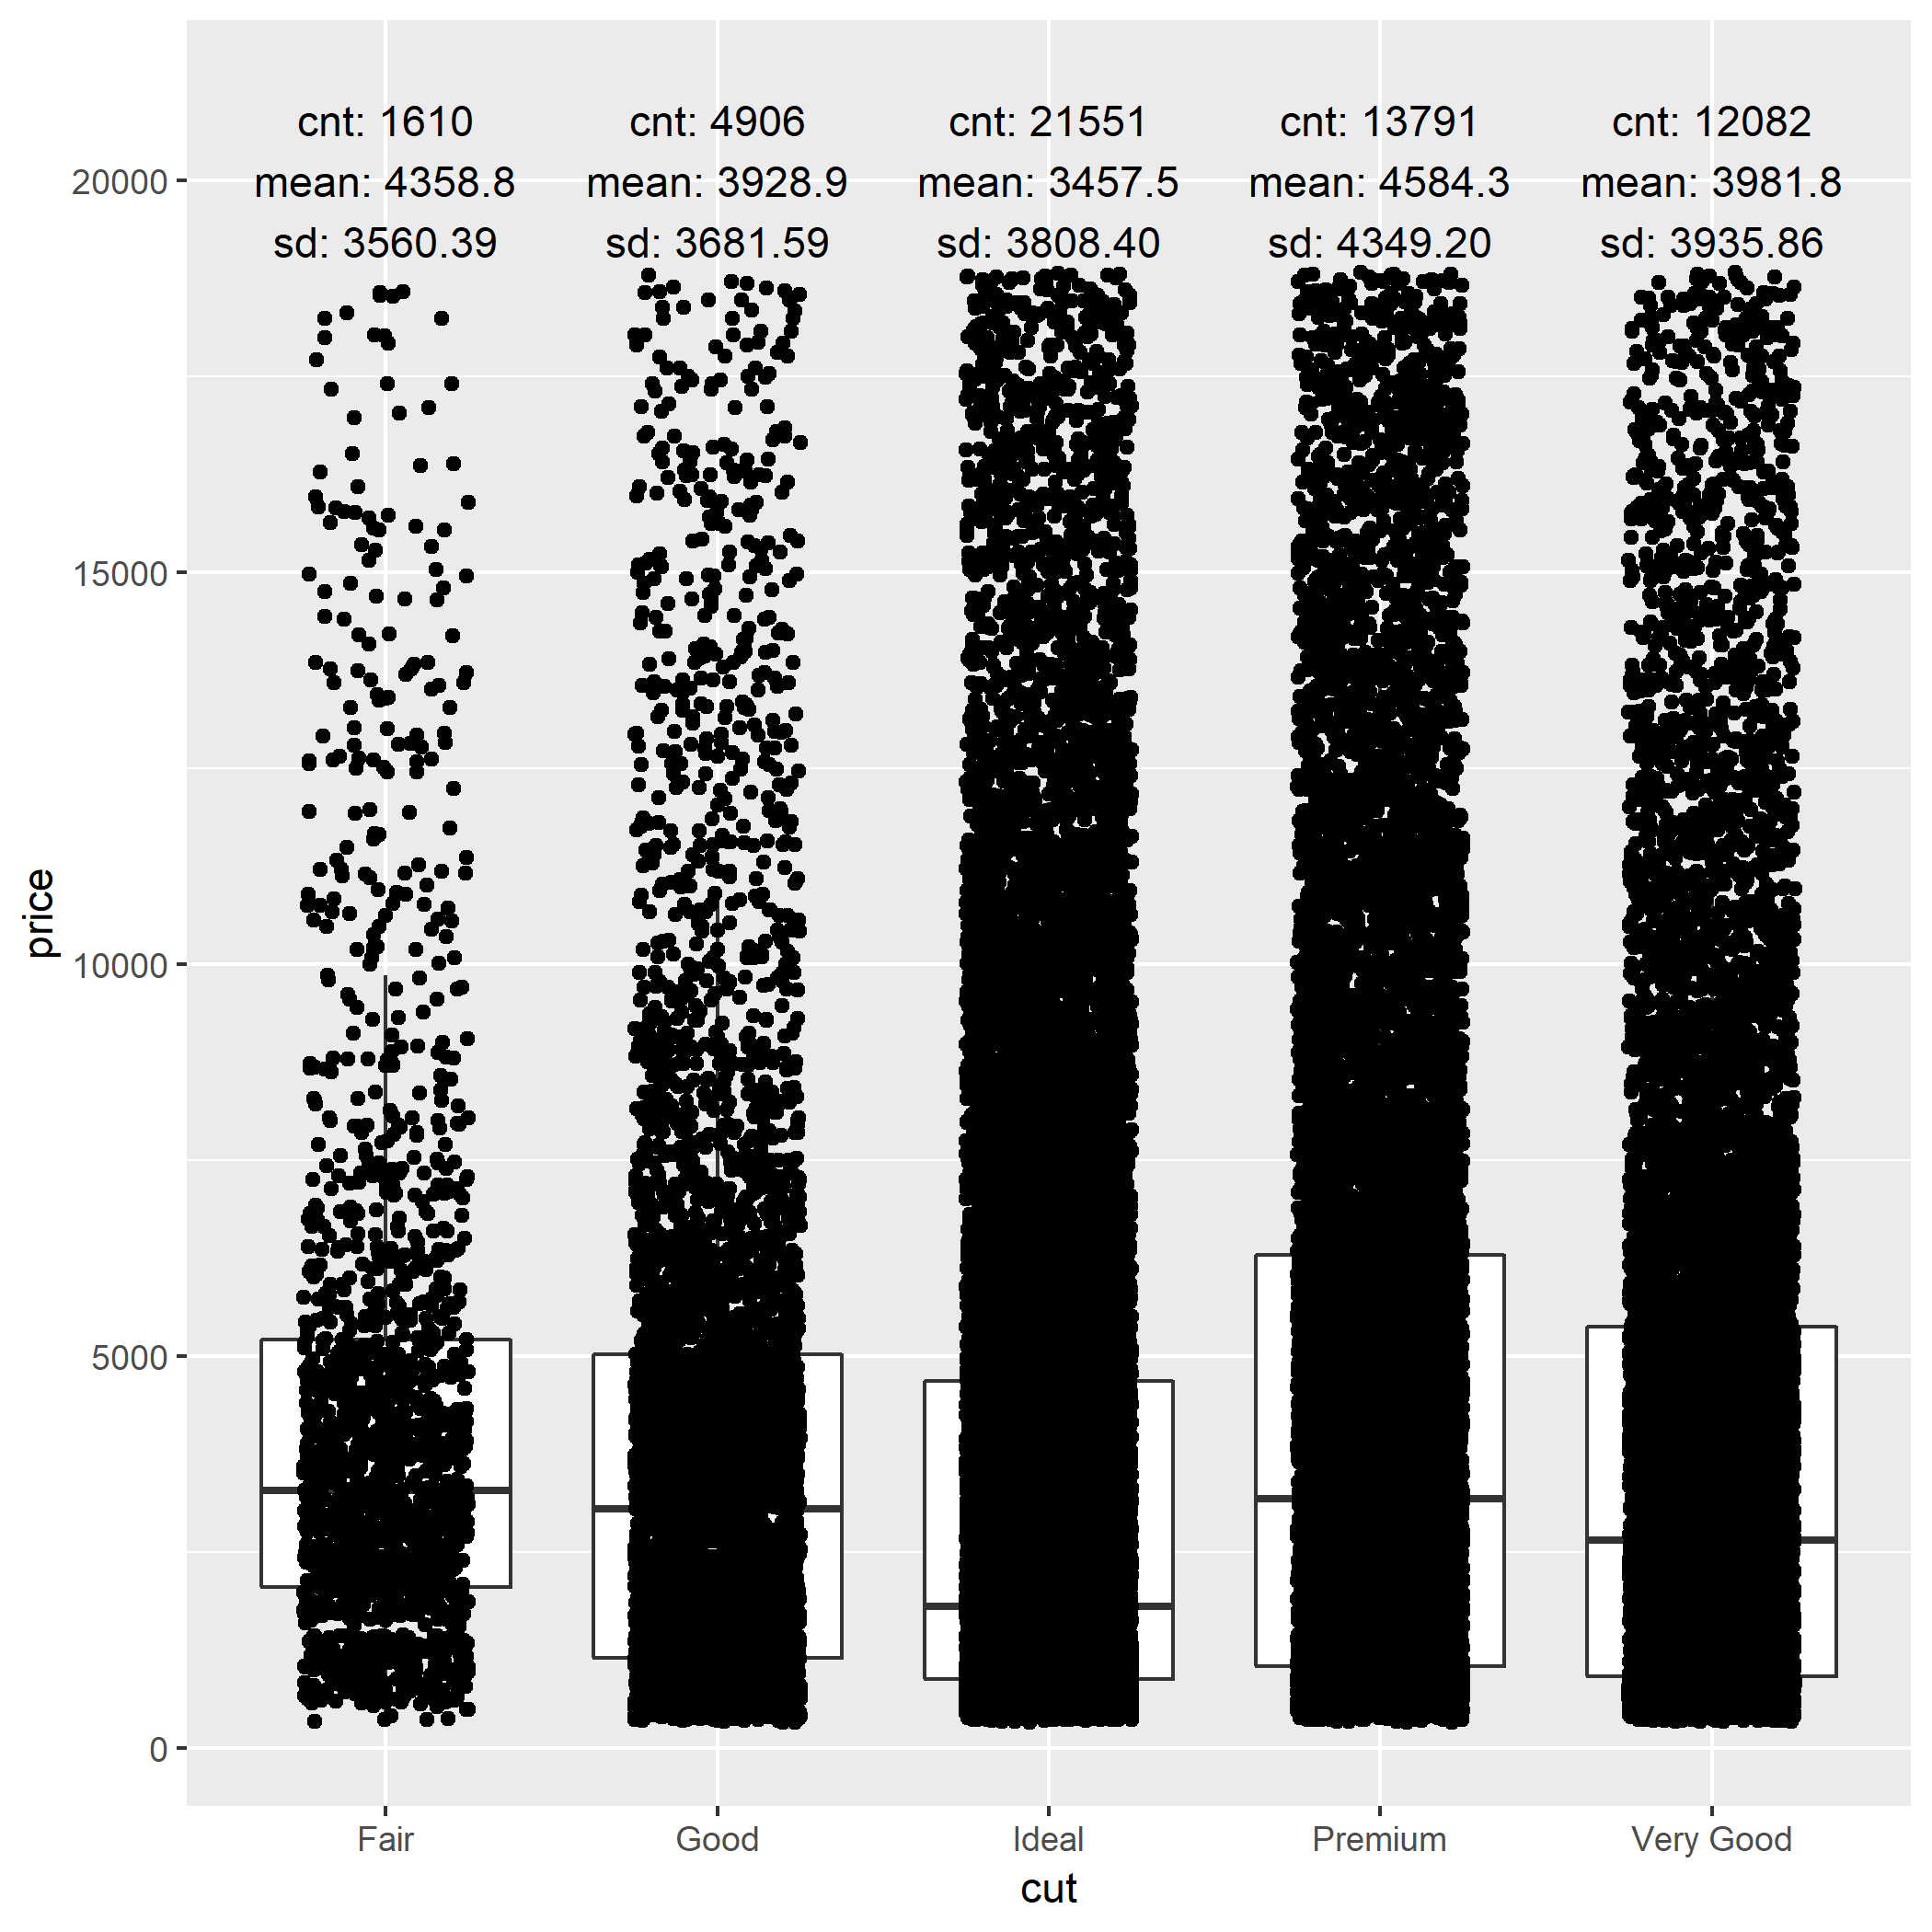
畫圖程式如下:

1
2
3
4
5
6
7
statDT <- diamondsDT[ , .(cnt = .N, mean = mean(price), sd = sd(price)), by = .(cut)] %>>%
`[`(j = label := sprintf("cnt: %i\nmean: %.1f\nsd: %.2f", cnt, mean, sd))
g <- ggplot(diamondsDT, aes(cut, price)) +
geom_boxplot(outlier.shape = NA) + geom_jitter(width = 0.25) +
ylim(c(300, 21000)) +
geom_text(aes(cut, 20000, label = label), statDT)
ggsave("boxplot_example.png", g, width = 7, height = 7)

第一步,我們先能夠產出ggplot2aes,讓他能吃characters

1
2
3
4
5
6
7
8
9
10
11
12
13
14
# 利用aes_string來達成,為什麼要用bquote,下面那段程式說明
aesExpr <- bquote(aes_string(x = "cut", y = "price"))
ggplot(diamondsDT, eval(aesExpr)) +
geom_boxplot(outlier.shape = NA) + geom_jitter(width = 0.25) +
ylim(c(300, 21000)) +
geom_text(aes(cut, 20000, label = label), statDT, inherit.aes = FALSE)

# 加點花樣 (不同的color給不同的顏色),使用bquote好處就是可以很容易新增其他變數
aesExpr <- bquote(aes_string(x = "cut", y = "price"))
aesExpr$colour <- "color"
ggplot(diamondsDT, eval(aesExpr)) +
geom_boxplot(outlier.shape = NA) + geom_jitter(width = 0.25) +
ylim(c(300, 21000)) +
geom_text(aes(cut, 20000, label = label), statDT, inherit.aes = FALSE)

第二步,我們將statDT用函數算出來,這邊大量使用data.table的技巧

1
2
3
4
5
6
7
8
9
10
11
12
13
14
15
16
17
18
19
20
21
22
23
24
25
26
27
28
29
30
31
32
33
34
35
36
37
38
39
40
41
42
43
44
45
46
47
48
49
50
51
52
53
54
55
56
getStatDTFunc <- function(DT, calVar, byVars,
labelName = "label",
sprintFmts = c("%i", "%.1f", "%.2f"),
funcList = list(cnt = length, mean = mean, sd = sd)) {
stopifnot(is.data.frame(DT), is.character(calVar),
length(calVar) == 1, calVar %in% names(DT),
is.character(labelName), length(labelName) == 1,
is.character(byVars), all(byVars %in% names(DT)),
all(grepl("^%[0-9.]*[if]", sprintFmts)),
length(sprintFmts) == length(funcList),
all(nchar(names(funcList)) > 0))
if (!is.data.table(DT))
DT <- data.table(DT)
outDT <- DT[ , lapply(funcList, function(f) f(get(calVar))) %>>%
setNames(names(funcList)), by = byVars]
fmt <- sprintf("%s: %s", names(funcList), sprintFmts) %>>% paste0(collapse = "\n")
outDT[ , eval(labelName) := do.call(sprintf, c(list(fmt = fmt), mget(names(funcList))))]
return(outDT)
}

# default
getStatDTFunc(diamondsDT, "price", "cut")
## 結果如下
# cut cnt mean sd label
# 1: Ideal 21551 3457.542 3808.401 cnt: 21551\nmean: 3457.5\nsd: 3808.40
# 2: Premium 13791 4584.258 4349.205 cnt: 13791\nmean: 4584.3\nsd: 4349.20
# 3: Good 4906 3928.864 3681.590 cnt: 4906\nmean: 3928.9\nsd: 3681.59
# 4: Very Good 12082 3981.760 3935.862 cnt: 12082\nmean: 3981.8\nsd: 3935.86
# 5: Fair 1610 4358.758 3560.387 cnt: 1610\nmean: 4358.8\nsd: 3560.39

# variant 1 (data.table has a bug on median.)
getStatDTFunc(diamondsDT, "price", "cut", "label", c("%i", "%.1f"),
list(cnt = length, median = function(x) quantile(x, 0.5)))
## 結果如下
# cut cnt median label
# 1: Ideal 21551 1810.0 cnt: 21551\nmedian: 1810.0
# 2: Premium 13791 3185.0 cnt: 13791\nmedian: 3185.0
# 3: Good 4906 3050.5 cnt: 4906\nmedian: 3050.5
# 4: Very Good 12082 2648.0 cnt: 12082\nmedian: 2648.0
# 5: Fair 1610 3282.0 cnt: 1610\nmedian: 3282.0

# variant 2
getStatDTFunc(diamondsDT, "price", "clarity", "label", c("%i", "%.1f", "%.1f", "%.1f"),
list(cnt = length, q25 = function(x) quantile(x, 0.25),
q50 = function(x) quantile(x, 0.5),
q75 = function(x) quantile(x, 0.75)))
## 結果如下
# clarity cnt q25 q50 q75 label
# 1: SI2 9194 2264.00 4072 5777.25 cnt: 9194\nq25: 2264.0\nq50: 4072.0\nq75: 5777.2
# 2: SI1 13065 1089.00 2822 5250.00 cnt: 13065\nq25: 1089.0\nq50: 2822.0\nq75: 5250.0
# 3: VS1 8171 876.00 2005 6023.00 cnt: 8171\nq25: 876.0\nq50: 2005.0\nq75: 6023.0
# 4: VS2 12258 900.00 2054 6023.75 cnt: 12258\nq25: 900.0\nq50: 2054.0\nq75: 6023.8
# 5: VVS2 5066 794.25 1311 3638.25 cnt: 5066\nq25: 794.2\nq50: 1311.0\nq75: 3638.2
# 6: VVS1 3655 816.00 1093 2379.00 cnt: 3655\nq25: 816.0\nq50: 1093.0\nq75: 2379.0
# 7: I1 741 2080.00 3344 5161.00 cnt: 741\nq25: 2080.0\nq50: 3344.0\nq75: 5161.0
# 8: IF 1790 895.00 1080 2388.50 cnt: 1790\nq25: 895.0\nq50: 1080.0\nq75: 2388.5

所以這樣一來,statDT的產生也能用函數產生了,最後就是寫畫圖函數了

1
2
3
4
5
6
7
8
9
10
11
12
13
14
15
16
17
18
19
20
21
22
23
24
25
26
27
28
29
30
31
32
33
34
boxPlotFunc <- function(data, x, y, colour = NULL,
title = "", xlab = x, ylab = y,
needStats = FALSE, statDT = NULL, labelCol = NULL,
textSize = 11, titleTextSize = rel(1.2), legendTitle = "",
legendTitleSize = rel(1), legendLabelSize = rel(0.8),
axisTitleSize = rel(0.8), axisTextSize = rel(0.8)) {
aesExpr <- bquote(aes_string(x = "cut", y = "price"))
labExpr <- bquote(labs(x = xlab, y = ylab, title = title))
if (!is.null(colour)) {
aesExpr$colour <- colour
labExpr$colour <- ifelse(nchar(legendTitle) == 0, colour, legendTitle)
}
g <- ggplot(data, eval(aesExpr)) + eval(labExpr) +
geom_boxplot(outlier.shape = NA) + geom_jitter(width = 0.25) +
theme(text = element_text(size = textSize),
plot.title = element_text(size = titleTextSize),
axis.title.x = element_text(size = axisTitleSize),
axis.title.y = element_text(size = axisTitleSize),
axis.text = element_text(size = axisTextSize),
legend.title = element_text(size = legendTitleSize),
legend.text = element_text(size = legendLabelSize))
if (needStats) {
calStatLoc <- extendrange(diamondsDT$price, f = 0.05)[2]
ylim <- c(extendrange(diamondsDT$price, f = 0.025)[1],
extendrange(diamondsDT$price, f = 0.075)[2])
if (!is.null(statDT) && !is.null(labelCol))
g <- g + ylim(ylim) +
geom_text(aes_string(x, y = as.character(calStatLoc), label = labelCol),
statDT, inherit.aes = FALSE)
else
warning("needStats is TRUE, but statDT or labelCol is null, so not add statistics.")
}
return(g)
}

這裡有幾點要說明

  1. relggplot2的相對大小的函數,ggplot2預設的text大小是11,則rel(0.8) = 11 * 0.8 = 8.8的size
  2. ggplot2參數預設值可以參考這裡

最後簡單的測試一下:

簡單功能測試:

1
boxPlotFunc(diamondsDT, "cut", "price")
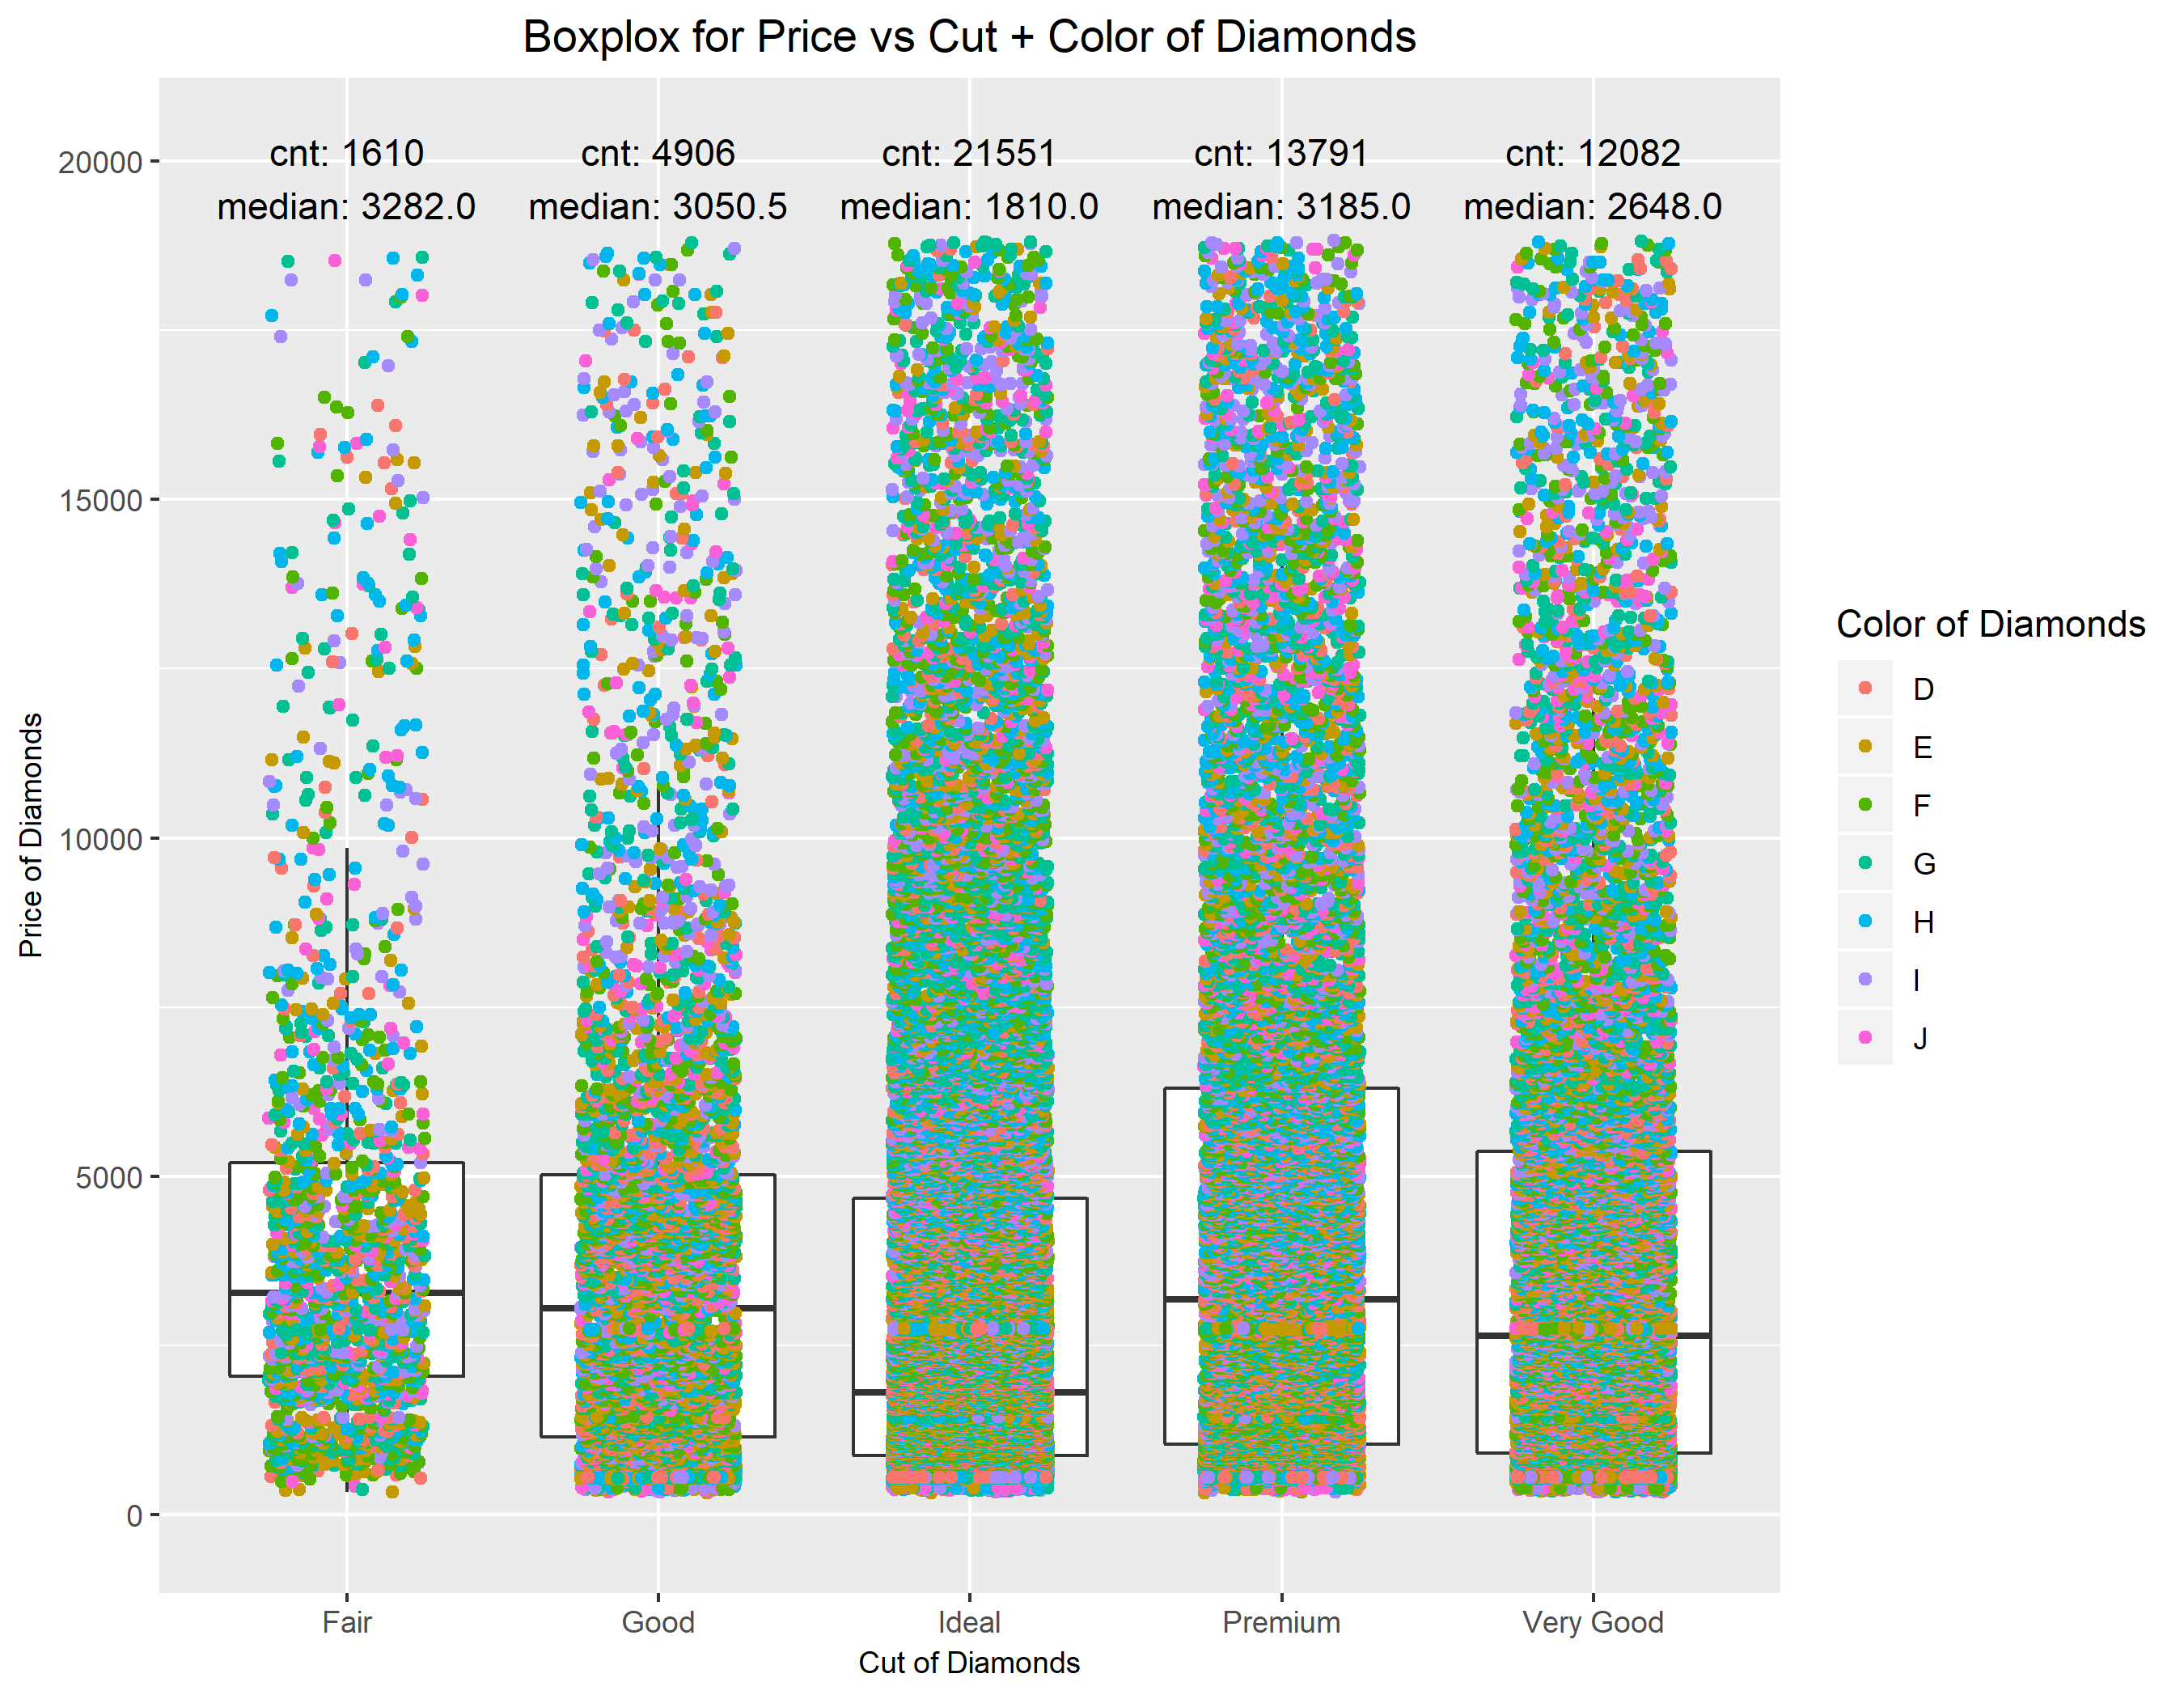
測試一下其他參數:

1
2
3
4
5
6
7
8
statDT <- getStatDTFunc(diamondsDT, "price", "cut", "label", c("%i", "%f"),
list(cnt = length, median = function(x) quantile(x, 0.5)))
g2 <- boxPlotFunc(diamondsDT, "cut", "price", "color",
"Boxplox for Price vs Cut + Color of Diamonds",
"Cut of Diamonds", "Price of Diamonds",
legendTitle = "Color of Diamonds",
needStats = TRUE, statDT = statDT, labelCol = "label")
ggsave("boxplot_final.png", g2, width = 9, height = 7)

圖: